
Page 307 - Annual Report 2022 - PLN Indonesia Power
P. 307
Analisis dan Pembahasan Manajemen
Management Discussion and Analysis
Perbandingan antara Target 2022, Realisasi 2022 dan Proyeksi 2023
Comparison between 2022 Target, 2022 Realization, and 2023 Projection
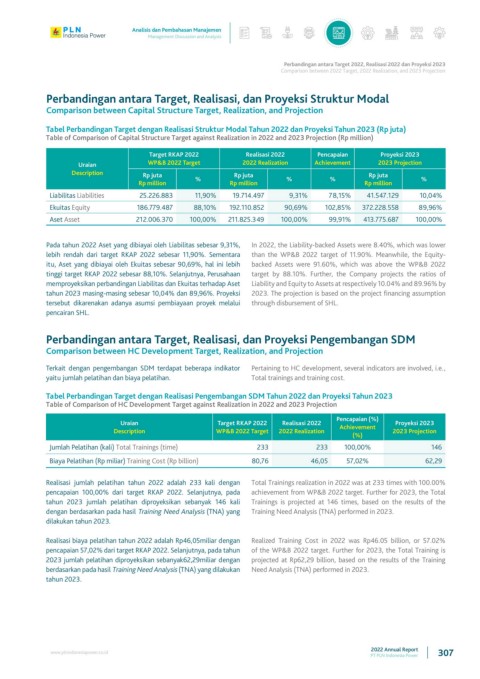
Perbandingan antara Target, Realisasi, dan Proyeksi Struktur Modal
Comparison between Capital Structure Target, Realization, and Projection
Tabel Perbandingan Target dengan Realisasi Struktur Modal Tahun 2022 dan Proyeksi Tahun 2023 (Rp juta)
Table of Comparison of Capital Structure Target against Realization in 2022 and 2023 Projection (Rp million)
Target RKAP 2022 Realisasi 2022 Pencapaian Proyeksi 2023
Uraian WP&B 2022 Target 2022 Realization Achievement 2023 Projection
Description Rp juta Rp juta Rp juta
Rp million % Rp million % % Rp million %
Liabilitas Liabilities 25.226.883 11,90% 19.714.497 9,31% 78,15% 41.547.129 10,04%
Ekuitas Equity 186.779.487 88,10% 192.110.852 90,69% 102,85% 372.228.558 89,96%
Aset Asset 212.006.370 100,00% 211.825.349 100,00% 99,91% 413.775.687 100,00%
Pada tahun 2022 Aset yang dibiayai oleh Liabilitas sebesar 9,31%, In 2022, the Liability-backed Assets were 8.40%, which was lower
lebih rendah dari target RKAP 2022 sebesar 11,90%. Sementara than the WP&B 2022 target of 11.90%. Meanwhile, the Equity-
itu, Aset yang dibiayai oleh Ekuitas sebesar 90,69%, hal ini lebih backed Assets were 91.60%, which was above the WP&B 2022
tinggi target RKAP 2022 sebesar 88,10%. Selanjutnya, Perusahaan target by 88.10%. Further, the Company projects the ratios of
memproyeksikan perbandingan Liabilitas dan Ekuitas terhadap Aset Liability and Equity to Assets at respectively 10.04% and 89.96% by
tahun 2023 masing-masing sebesar 10,04% dan 89,96%. Proyeksi 2023. The projection is based on the project financing assumption
tersebut dikarenakan adanya asumsi pembiayaan proyek melalui through disbursement of SHL.
pencairan SHL.
Perbandingan antara Target, Realisasi, dan Proyeksi Pengembangan SDM
Comparison between HC Development Target, Realization, and Projection
Terkait dengan pengembangan SDM terdapat beberapa indikator Pertaining to HC development, several indicators are involved, i.e.,
yaitu jumlah pelatihan dan biaya pelatihan. Total trainings and training cost.
Tabel Perbandingan Target dengan Realisasi Pengembangan SDM Tahun 2022 dan Proyeksi Tahun 2023
Table of Comparison of HC Development Target against Realization in 2022 and 2023 Projection
Pencapaian (%)
Uraian Target RKAP 2022 Realisasi 2022 Proyeksi 2023
Description WP&B 2022 Target 2022 Realization Achievement 2023 Projection
(%)
Jumlah Pelatihan (kali) Total Trainings (time) 233 233 100,00% 146
Biaya Pelatihan (Rp miliar) Training Cost (Rp billion) 80,76 46,05 57,02% 62,29
Realisasi jumlah pelatihan tahun 2022 adalah 233 kali dengan Total Trainings realization in 2022 was at 233 times with 100.00%
pencapaian 100,00% dari target RKAP 2022. Selanjutnya, pada achievement from WP&B 2022 target. Further for 2023, the Total
tahun 2023 jumlah pelatihan diproyeksikan sebanyak 146 kali Trainings is projected at 146 times, based on the results of the
dengan berdasarkan pada hasil Training Need Analysis (TNA) yang Training Need Analysis (TNA) performed in 2023.
dilakukan tahun 2023.
Realisasi biaya pelatihan tahun 2022 adalah Rp46,05miliar dengan Realized Training Cost in 2022 was Rp46.05 billion, or 57.02%
pencapaian 57,02% dari target RKAP 2022. Selanjutnya, pada tahun of the WP&B 2022 target. Further for 2023, the Total Training is
2023 jumlah pelatihan diproyeksikan sebanyak62,29miliar dengan projected at Rp62,29 billion, based on the results of the Training
berdasarkan pada hasil Training Need Analysis (TNA) yang dilakukan Need Analysis (TNA) performed in 2023.
tahun 2023.
2022 Annual Report
www.plnindonesiapower.co.id 307
PT PLN Indonesia Power