
Page 666 - Annual Report 2022 - PLN Indonesia Power
P. 666
Powering Sustainable
and Prosperous Future
PT INDONESIA POWER DAN ENTITAS ANAKNYA/AND ITS SUBSIDIARIES
Lampiran 5/67 Schedule
CATATAN ATAS LAPORAN KEUANGAN NOTES TO THE CONSOLIDATED
KONSOLIDASIAN FINANCIAL STATEMENTS
31 DESEMBER 2022 DAN 2021 31 DECEMBER 2022 AND 2021
(Dinyatakan dalam jutaan Rupiah, kecuali dinyatakan lain) (Expressed in millions of Rupiah, unless otherwise stated)
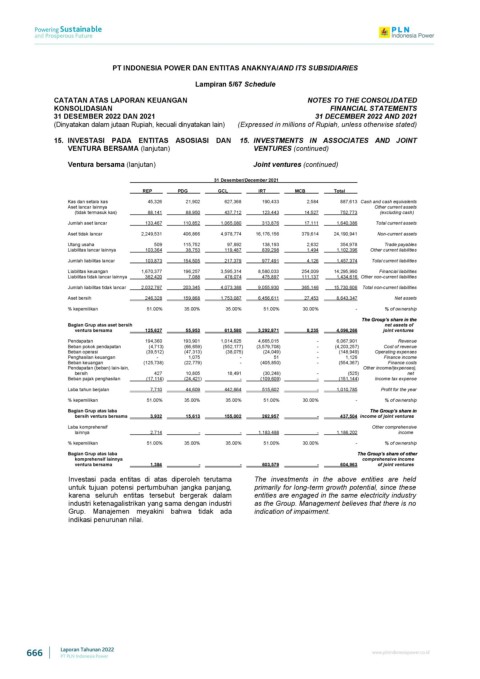
15. INVESTASI PADA ENTITAS ASOSIASI DAN 15. INVESTMENTS IN ASSOCIATES AND JOINT
VENTURA BERSAMA (lanjutan) VENTURES (continued)
Ventura bersama (lanjutan) Joint ventures (continued)
31 Desember/December 2021
REP PDG GCL IRT MCB Total
Kas dan setara kas 45,326 21,902 627,368 190,433 2,584 887,613 Cash and cash equivalents
Aset lancar lainnya Other current assets
(tidak termasuk kas) 88,141 88,950 437,712 123,443 14,527 752,773 (excluding cash)
Jumlah aset lancar 133,467 110,852 1,065,080 313,876 17,111 1,640,386 Total current assets
Aset tidak lancar 2,249,531 406,866 4,978,774 16,176,156 379,614 24,190,941 Non-current assets
Utang usaha 509 115,752 97,892 138,193 2,632 354,978 Trade payables
Liabilitas lancar lainnya 103,364 38,753 119,487 839,298 1,494 1,102,396 Other current liabilities
Jumlah liabilitas lancar 103,873 154,505 217,379 977,491 4,126 1,457,374 Total current liabilities
Liabilitas keuangan 1,670,377 196,257 3,595,314 8,580,033 254,009 14,295,990 Financial liabilities
Liabilitas tidak lancar lainnya 362,420 7,088 478,074 475,897 111,137 1,434,616 Other non-current liabilities
Jumlah liabilitas tidak lancar 2,032,797 203,345 4,073,388 9,055,930 365,146 15,730,606 Total non-current liabilities
Aset bersih 246,328 159,868 1,753,087 6,456,611 27,453 8,643,347 Net assets
% kepemilikan 51.00% 35.00% 35.00% 51.00% 30.00% - % of ownership
Bagian Grup atas aset bersih net assets of
ventura bersama 125,627 55,953 613,580 3,292,871 8,235 4,096,266 joint ventures
Pendapatan 194,360 193,901 1,014,625 4,665,015 - 6,067,901 Revenue
Beban pokok pendapatan (4,713) (66,659) (552,177) (3,579,708) - (4,203,257) Cost of revenue
Beban operasi (39,512) (47,313) (38,075) (24,049) - (148,949) Operating expenses
Penghasilan keuangan - 1,075 - 51 - 1,126 Finance income
Beban keuangan (125,738) (22,779) - (405,850) - (554,367) Finance costs
Pendapatan (beban) lain-lain, Other income/(expenses),
bersih 427 10,805 18,491 (30,248) - (525) net
Beban pajak penghasilan (17,114) (24,421) - (109,609) - (151,144) Income tax expense
Laba tahun berjalan 7,710 44,609 442,864 515,602 - 1,010,785 Profit for the year
% kepemilikan 51.00% 35.00% 35.00% 51.00% 30.00% - % of ownership
Bagian Grup atas laba
bersih ventura bersama 3,932 15,613 155,002 262,957 - 437,504 income of joint ventures
Laba komprehensif Other comprehensive
lainnya 2,714 - - 1,183,488 - 1,186,202 income
% kepemilikan 51.00% 35.00% 35.00% 51.00% 30.00% - % of ownership
Bagian Grup atas laba
komprehensif lainnya comprehensive income
ventura bersama 1,384 - - 603,579 - 604,963 of joint ventures
Investasi pada entitas di atas diperoleh terutama The investments in the above entities are held
untuk tujuan potensi pertumbuhan jangka panjang, primarily for long-term growth potential, since these
karena seluruh entitas tersebut bergerak dalam entities are engaged in the same electricity industry
industri ketenagalistrikan yang sama dengan industri as the Group. Management believes that there is no
Grup. Manajemen meyakini bahwa tidak ada indication of impairment.
indikasi penurunan nilai.
666 Laporan Tahunan 2022 www.plnindonesiapower.co.id
PT PLN Indonesia Power