
Page 665 - Annual Report 2022 - PLN Indonesia Power
P. 665
Laporan Keuangan Audited 2022
Audited Financial Statement 2022
PT INDONESIA POWER DAN ENTITAS ANAKNYA/AND ITS SUBSIDIARIES
Lampiran 5/66 Schedule
CATATAN ATAS LAPORAN KEUANGAN NOTES TO THE CONSOLIDATED
KONSOLIDASIAN FINANCIAL STATEMENTS
31 DESEMBER 2022 DAN 2021 31 DECEMBER 2022 AND 2021
(Dinyatakan dalam jutaan Rupiah, kecuali dinyatakan lain) (Expressed in millions of Rupiah, unless otherwise stated)
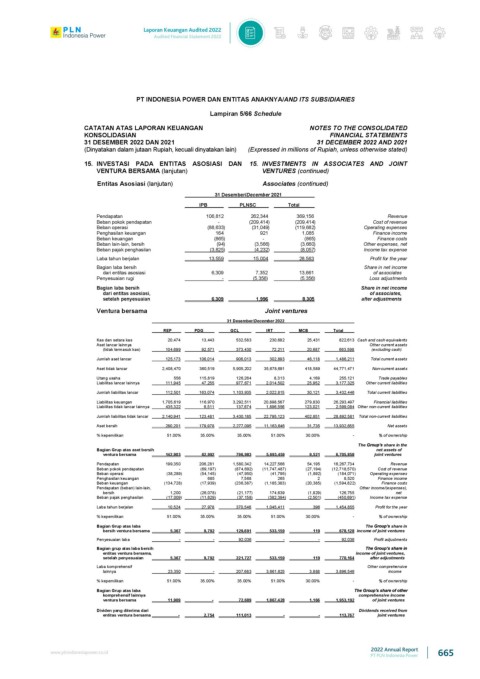
15. INVESTASI PADA ENTITAS ASOSIASI DAN 15. INVESTMENTS IN ASSOCIATES AND JOINT
VENTURA BERSAMA (lanjutan) VENTURES (continued)
Entitas Asosiasi (lanjutan) Associates (continued)
31 Desember/December 2021
IPB PLNSC Total
Pendapatan 106,812 262,344 369,156 Revenue
Beban pokok pendapatan - (209,414) (209,414) Cost of revenue
Beban operasi (88,633) (31,049) (119,682) Operating expenses
Penghasilan keuangan 164 921 1,085 Finance income
Beban keuangan (865) - (865) Finance costs
Beban lain-lain, bersih (94) (3,566) (3,660) Other expenses, net
Beban pajak penghasilan (3,825) (4,232) (8,057) Income tax expense
Laba tahun berjalan 13,559 15,004 28,563 Profit for the year
Bagian laba bersih Share in net income
dari entitas asosiasi 6,309 7,352 13,661 of associates
Penyesuaian rugi - (5,356) (5,356) Loss adjustments
Bagian laba bersih Share in net income
dari entitas asosiasi, of associates,
setelah penyesuaian 6,309 1,996 8,305 after adjustments
Ventura bersama Joint ventures
31 Desember/December 2022
REP PDG GCL IRT MCB Total
Kas dan setara kas 20,474 13,443 532,583 230,682 25,431 822,613 Cash and cash equivalents
Aset lancar lainnya Other current assets
(tidak termasuk kas) 104,699 92,571 373,430 72,211 20,687 663,598 (excluding cash)
Jumlah aset lancar 125,173 106,014 906,013 302,893 46,118 1,486,211 Total current assets
Aset tidak lancar 2,408,470 360,519 5,905,202 35,678,691 418,589 44,771,471 Non-current assets
Utang usaha 556 115,819 126,264 8,313 4,169 255,121 Trade payables
Liabilitas lancar lainnya 111,945 47,255 977,671 2,014,502 25,952 3,177,325 Other current liabilities
Jumlah liabilitas lancar 112,501 163,074 1,103,935 2,022,815 30,121 3,432,446 Total current liabilities
Liabilitas keuangan 1,705,619 116,970 3,292,511 20,898,567 279,830 26,293,497 Financial liabilities
Liabilitas tidak lancar lainnya 435,322 6,511 137,674 1,896,556 123,021 2,599,084 Other non-current liabilities
Jumlah liabilitas tidak lancar 2,140,941 123,481 3,430,185 22,795,123 402,851 28,892,581 Total non-current liabilities
Aset bersih 280,201 179,978 2,277,095 11,163,646 31,735 13,932,655 Net assets
% kepemilikan 51.00% 35.00% 35.00% 51.00% 30.00% - % of ownership
The share in the
Bagian Grup atas aset bersih net assets of
ventura bersama 142,903 62,992 796,983 5,693,459 9,521 6,705,858 joint ventures
Pendapatan 199,350 206,281 1,580,342 14,227,566 54,195 16,267,734 Revenue
Beban pokok pendapatan - (69,197) (874,692) (11,747,487) (27,194) (12,718,570) Cost of revenue
Beban operasi (38,289) (54,145) (47,950) (41,795) (1,892) (184,071) Operating expenses
Penghasilan keuangan - 685 7,568 265 2 8,520 Finance income
Beban keuangan (134,728) (17,939) (236,387) (1,185,383) (20,385) (1,594,822) Finance costs
Pendapatan (beban) lain-lain, Other income/(expenses),
bersih 1,200 (26,078) (21,177) 174,639 (1,829) 126,755 net
Beban pajak penghasilan (17,009) (11,629) (37,158) (382,394) (2,501) (450,691) Income tax expense
Laba tahun berjalan 10,524 27,978 370,546 1,045,411 396 1,454,855 Profit for the year
% kepemilikan 51.00% 35.00% 35.00% 51.00% 30.00% - % of ownership
Bagian Grup atas laba The share in
bersih ventura bersama 5,367 9,792 129,691 533,159 119 678,128 income of joint ventures
Penyesuaian laba - - 92,036 - - 92,036 Profit adjustments
Bagian grup atas laba bersih
entitas ventura bersama, income of joint ventures,
setelah penyesuaian 5,367 9,792 221,727 533,159 119 770,164 after adjustments
Laba komprehensif Other comprehensive
lainnya 23,350 - 207,683 3,661,625 3,888 3,896,546 income
% kepemilikan 51.00% 35.00% 35.00% 51.00% 30.00% - % of ownership
Bagian Grup atas laba
komprehensif lainnya comprehensive income
ventura bersama 11,909 - 72,689 1,867,428 1,166 1,953,192 of joint ventures
Dividen yang diterima dari Dividends received from
entitas ventura bersama - 2,754 111,013 - - 113,767 joint ventures
2022 Annual Report
www.plnindonesiapower.co.id 665
PT PLN Indonesia Power