
Page 48 - Laporan Statistik 2022 - PLN Indonesia Power
P. 48
Statistic Report
PT PLN Indonesia Power 2022
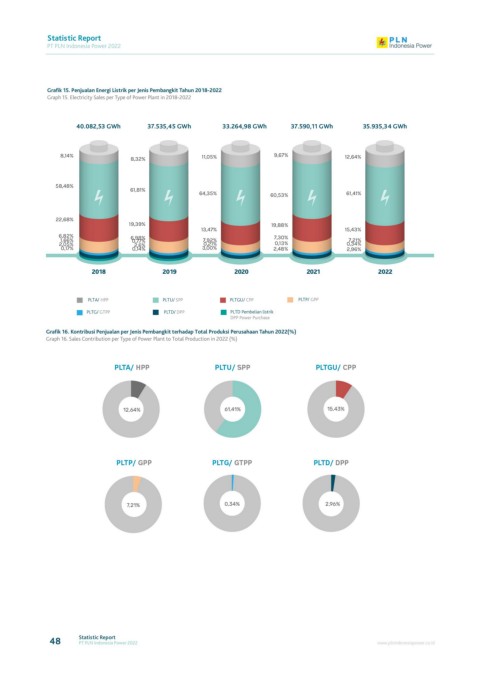
grafik 15. penjualan Energi Listrik per Jenis pembangkit tahun 2018-2022
Graph 15. Electricity Sales per Type of Power Plant in 2018-2022
40.082,53 gWh 37.535,45 gWh 33.264,98 gWh 37.590,11 gWh 35.935,34 gWh
8,14% 11,05% 9,67% 12,64%
8,32%
58,48%
61,81%
64,35% 60,53% 61,41%
22,68%
19,39% 19,88%
13,47% 15,43%
6,82% 6,98% 7,92% 7,30% 7,21%
1,66%
2,05% 0,77% 0,21% 0,13% 0,34%
2,6%
0,17% 0,14% 3,00% 2,48% 2,96%
2018 2019 2020 2021 2022
PLTA/ HPP PLTU/ SPP PLTGU/ CPP PLTP/ GPP
PLTG/ GTPP PLTD/ DPP PLTD Pembelian listrik
DPP Power Purchase
grafik 16. kontribusi penjualan per Jenis pembangkit terhadap total produksi perusahaan tahun 2022(%)
Graph 16. Sales Contribution per Type of Power Plant to Total Production in 2022 (%)
PLTA/ HPP PLTU/ SPP PLTGU/ CPP
12,64% 61,41% 15,43%
PLTP/ GPP PLTG/ GTPP PLTD/ DPP
7,21% 0,34% 2,96%
48 Statistic Report www.plnindonesiapower.co.id
PT PLN Indonesia Power 2022