
Page 61 - Laporan Statistik 2022 - PLN Indonesia Power
P. 61
Kinerja Operasional
Operation Performance
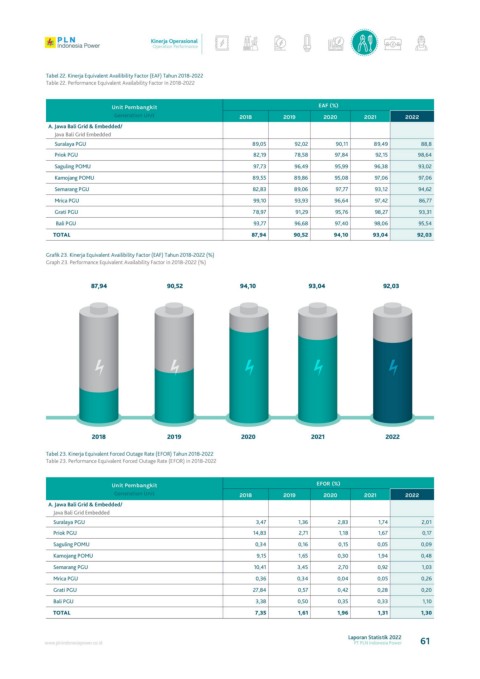
Tabel 22. Kinerja Equivalent Availibility Factor (EAF) Tahun 2018-2022
Table 22. Performance Equivalent Availability Factor in 2018-2022
Unit Pembangkit EAF (%)
Generation Unit 2018 2019 2020 2021 2022
a. Jawa Bali Grid & embedded/
Java Bali Grid Embedded
Suralaya PGU 89,05 92,02 90,11 89,49 88,8
Priok PGU 82,19 78,58 97,84 92,15 98,64
Saguling POMU 97,73 96,49 95,99 96,38 93,02
Kamojang POMU 89,55 89,86 95,08 97,06 97,06
Semarang PGU 82,83 89,06 97,77 93,12 94,62
Mrica PGU 99,10 93,93 96,64 97,42 86,77
Grati PGU 78,97 91,29 95,76 98,27 93,31
Bali PGU 93,77 96,68 97,40 98,06 95,54
TOTAL 87,94 90,52 94,10 93,04 92,03
Grafik 23. Kinerja Equivalent Availibility Factor (EAF) Tahun 2018-2022 (%)
Graph 23. Performance Equivalent Availability Factor in 2018-2022 (%)
87,94 90,52 94,10 93,04 92,03
2018 2019 2020 2021 2022
Tabel 23. Kinerja Equivalent Forced Outage Rate (EFOR) Tahun 2018-2022
Table 23. Performance Equivalent Forced Outage Rate (EFOR) in 2018-2022
Unit Pembangkit EFOR (%)
Generation Unit 2018 2019 2020 2021 2022
a. Jawa Bali Grid & embedded/
Java Bali Grid Embedded
Suralaya PGU 3,47 1,36 2,83 1,74 2,01
Priok PGU 14,83 2,71 1,18 1,67 0,17
Saguling POMU 0,34 0,16 0,15 0,05 0,09
Kamojang POMU 9,15 1,65 0,30 1,94 0,48
Semarang PGU 10,41 3,45 2,70 0,92 1,03
Mrica PGU 0,36 0,34 0,04 0,05 0,26
Grati PGU 27,84 0,57 0,42 0,28 0,20
Bali PGU 3,38 0,50 0,35 0,33 1,10
TOTAL 7,35 1,61 1,96 1,31 1,30
Laporan Statistik 2022
www.plnindonesiapower.co.id PT PLN Indonesia Power 61