
Page 123 - Annual Report 2022 - PLN Indonesia Power
P. 123
Profil Perusahaan
Company Profile
Komposisi dan Pengembangan Kompetensi Pegawai
Employee Competency and Development
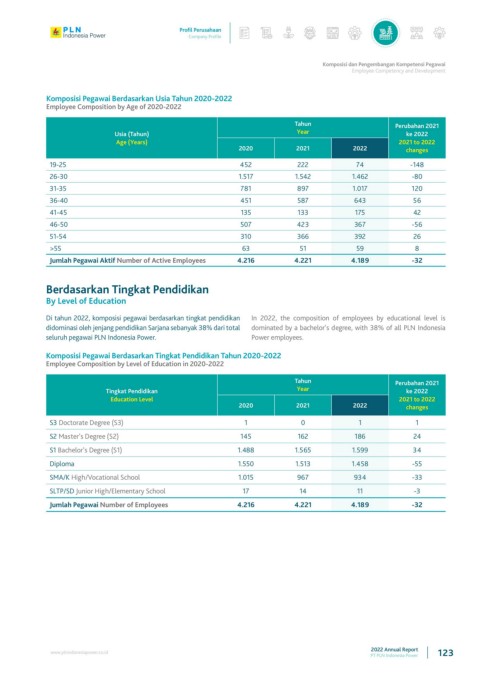
Komposisi Pegawai Berdasarkan Usia Tahun 2020-2022
Employee Composition by Age of 2020-2022
Tahun Perubahan 2021
Usia (Tahun) Year ke 2022
Age (Years) 2021 to 2022
2020 2021 2022 changes
19-25 452 222 74 -148
26-30 1.517 1.542 1.462 -80
31-35 781 897 1.017 120
36-40 451 587 643 56
41-45 135 133 175 42
46-50 507 423 367 -56
51-54 310 366 392 26
>55 63 51 59 8
Jumlah Pegawai Aktif Number of Active Employees 4.216 4.221 4.189 -32
Berdasarkan Tingkat Pendidikan
By Level of Education
Di tahun 2022, komposisi pegawai berdasarkan tingkat pendidikan In 2022, the composition of employees by educational level is
didominasi oleh jenjang pendidikan Sarjana sebanyak 38% dari total dominated by a bachelor's degree, with 38% of all PLN Indonesia
seluruh pegawai PLN Indonesia Power. Power employees.
Komposisi Pegawai Berdasarkan Tingkat Pendidikan Tahun 2020-2022
Employee Composition by Level of Education in 2020-2022
Tahun Perubahan 2021
Tingkat Pendidikan Year ke 2022
Education Level 2021 to 2022
2020 2021 2022 changes
S3 Doctorate Degree (S3) 1 0 1 1
S2 Master’s Degree (S2) 145 162 186 24
S1 Bachelor’s Degree (S1) 1.488 1.565 1.599 34
Diploma 1.550 1.513 1.458 -55
SMA/K High/Vocational School 1.015 967 934 -33
SLTP/SD Junior High/Elementary School 17 14 11 -3
Jumlah Pegawai Number of Employees 4.216 4.221 4.189 -32
2022 Annual Report
www.plnindonesiapower.co.id 123
PT PLN Indonesia Power