
Page 74 - Laporan Statistik 2022 - PLN Indonesia Power
P. 74
Statistic Report
PT PLN Indonesia Power 2022
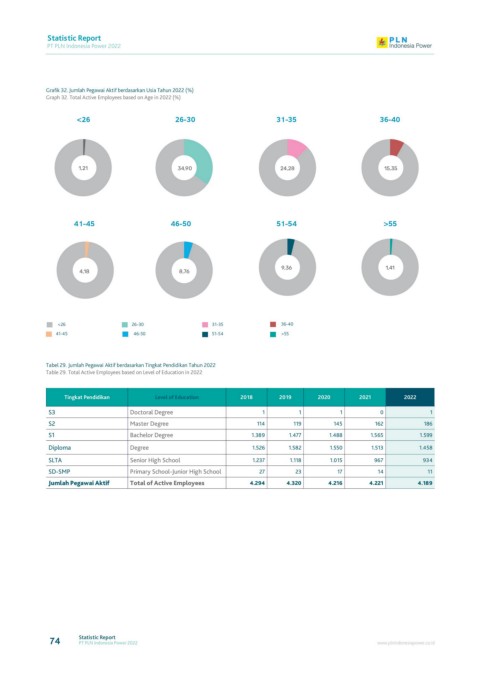
Grafik 32. Jumlah Pegawai Aktif berdasarkan Usia Tahun 2022 (%)
Graph 32. Total Active Employees based on Age in 2022 (%)
<26 26-30 31-35 36-40
1,21 34,90 24,28 15,35
41-45 46-50 51-54 >55
9,36 1,41
4,18 8,76
<26 26-30 31-35 36-40
41-45 46-50 51-54 >55
Tabel 29. Jumlah Pegawai Aktif berdasarkan Tingkat Pendidikan Tahun 2022
Table 29. Total Active Employees based on Level of Education in 2022
Tingkat Pendidikan Level of education 2018 2019 2020 2021 2022
S3 Doctoral Degree 1 1 1 0 1
S2 Master Degree 114 119 145 162 186
S1 Bachelor Degree 1.389 1.477 1.488 1.565 1.599
Diploma Degree 1.526 1.582 1.550 1.513 1.458
SLTA Senior High School 1.237 1.118 1.015 967 934
SD-SMP Primary School-Junior High School 27 23 17 14 11
Jumlah Pegawai Aktif Total of Active Employees 4.294 4.320 4.216 4.221 4.189
74 Statistic Report www.plnindonesiapower.co.id
PT PLN Indonesia Power 2022