
Page 68 - Laporan Statistik 2022 - PLN Indonesia Power
P. 68
Statistic Report
PT PLN Indonesia Power 2022
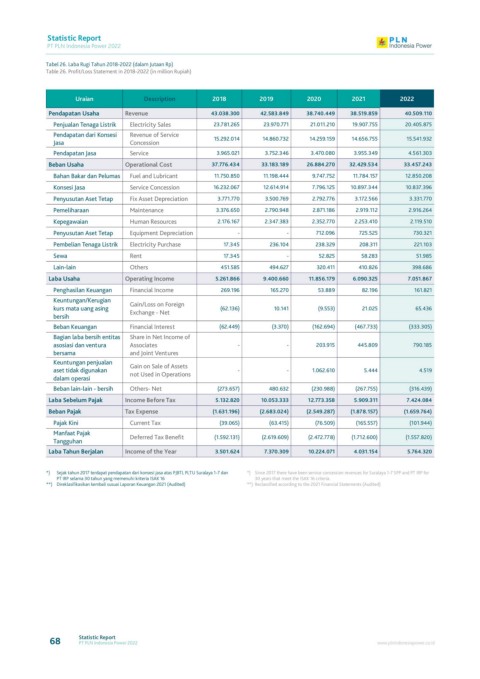
Tabel 26. Laba Rugi Tahun 2018-2022 (dalam Jutaan Rp)
Table 26. Profit/Loss Statement in 2018-2022 (in million Rupiah)
Uraian Description 2018 2019 2020 2021 2022
Pendapatan Usaha revenue 43.038.300 42.583.849 38.740.449 38.519.859 40.509.110
Penjualan Tenaga Listrik Electricity Sales 23.781.265 23.970.771 21.011.210 19.907.755 20.405.875
Pendapatan dari Konsesi Revenue of Service 15.292.014 14.860.732 14.259.159 14.656.755 15.541.932
Jasa Concession
Pendapatan Jasa Service 3.965.021 3.752.346 3.470.080 3.955.349 4.561.303
Beban Usaha Operational Cost 37.776.434 33.183.189 26.884.270 32.429.534 33.457.243
Bahan Bakar dan Pelumas Fuel and Lubricant 11.750.850 11.198.444 9.747.752 11.784.157 12.850.208
Konsesi Jasa Service Concession 16.232.067 12.614.914 7.796.125 10.897.344 10.837.396
Penyusutan Aset Tetap Fix Asset Depreciation 3.771.770 3.500.769 2.792.776 3.172.566 3.331.770
Pemeliharaan Maintenance 3.376.650 2.790.948 2.871.186 2.919.112 2.916.264
Kepegawaian Human Resources 2.176.167 2.347.383 2.352.770 2.253.410 2.119.510
Penyusutan Aset Tetap Equipment Depreciation - - 712.096 725.525 730.321
Pembelian Tenaga Listrik Electricity Purchase 17.345 236.104 238.329 208.311 221.103
Sewa Rent 17.345 - 52.825 58.283 51.985
Lain-lain Others 451.585 494.627 320.411 410.826 398.686
Laba Usaha Operating income 5.261.866 9.400.660 11.856.179 6.090.325 7.051.867
Penghasilan Keuangan Financial Income 269.196 165.270 53.889 82.196 161.821
Keuntungan/Kerugian Gain/Loss on Foreign
kurs mata uang asing Exchange - Net (62.136) 10.141 (9.553) 21.025 65.436
bersih
Beban Keuangan Financial Interest (62.449) (3.370) (162.694) (467.733) (333.305)
Bagian laba bersih entitas Share in Net Income of
asosiasi dan ventura Associates - - 203.915 445.809 790.185
bersama and Joint Ventures
Keuntungan penjualan Gain on Sale of Assets
aset tidak digunakan not Used in Operations - - 1.062.610 5.444 4.519
dalam operasi
Beban lain-lain - bersih Others- Net (273.657) 480.632 (230.988) (267.755) (316.439)
Laba sebelum Pajak income Before Tax 5.132.820 10.053.333 12.773.358 5.909.311 7.424.084
Beban Pajak Tax expense (1.631.196) (2.683.024) (2.549.287) (1.878.157) (1.659.764)
Pajak Kini Current Tax (39.065) (63.415) (76.509) (165.557) (101.944)
Manfaat Pajak Deferred Tax Benefit (1.592.131) (2.619.609) (2.472.778) (1.712.600) (1.557.820)
Tangguhan
Laba Tahun Berjalan income of the Year 3.501.624 7.370.309 10.224.071 4.031.154 5.764.320
*) Sejak tahun 2017 terdapat pendapatan dari konsesi jasa atas PJBTL PLTU Suralaya 1-7 dan *) Since 2017 there have been service concession revenues for Suralaya 1-7 SPP and PT IRP for
PT IRP selama 30 tahun yang memenuhi kriteria ISAK 16 30 years that meet the ISAK 16 criteria.
**) Direklasifikasikan kembali susuai Laporan Keuangan 2021 (Audited) **) Reclassified according to the 2021 Financial Statements (Audited)
68 Statistic Report www.plnindonesiapower.co.id
PT PLN Indonesia Power 2022